
The counting rule: more than 1 second, at least 50 percent visible
YouTube does not count an impression every time your thumbnail exists somewhere on a screen. Its published rule is specific: the thumbnail has to be displayed for more than 1 second and be at least 50 percent visible. Anything shorter or more hidden than that is not registered at all, which means a thumbnail that scrolled past in half a second never happened as far as your analytics are concerned.
That single rule already explains a large share of the confusion. On mobile, a fast scroll through the home feed can push five or six thumbnails past the eye in under a second each, and none of them counts. The number in Studio is not shown to you, it is shown to you plus a quality bar, and the bar exists so that impressions mean something closer to a real chance.
So the first correction to make is to stop reading impressions as exposure. Read them as qualified offers: the number of times YouTube put your cover in front of a person long enough and large enough for a decision to be possible. A low number does not mean the video is bad. It means few decisions were offered.
The seven places that never count, and why you can have views with barely any impressions
Impressions are counted only on YouTube surfaces: search results, the home page including autoplay, the subscriptions feed, trending, history, Watch Later, and the up next list beside the player, across computers, TVs, game consoles, Android, iPhone and iPad.
Everything else is invisible to that counter. Traffic can arrive, watch time can accumulate, and the impressions number can stay almost flat, which is exactly the situation that makes people think their video was buried when it was simply arriving from somewhere that does not register.
- External websites and embedded players: your own blog, a newsletter, a forum post.
- The YouTube mobile website, as opposed to the app.
- YouTube Kids and YouTube Music.
- Anything inside the player itself, including cards and end screens.
- Emails and notifications, so a subscriber alert that produced a view produced no impression.
- Videos playing in a background tab.
- Playlists, and TrueView video discovery ads.
Impressions are the offer, not the audience
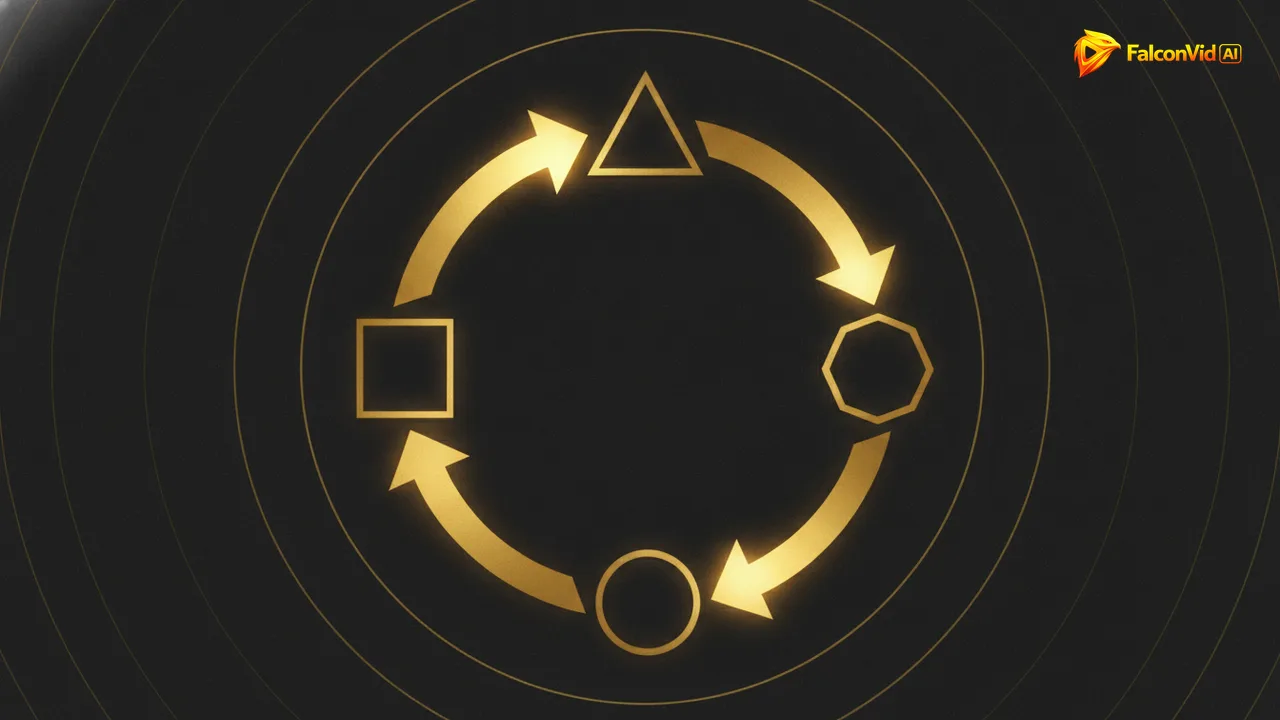
The mental model that fixes most of this is a loop with four stations. YouTube makes an offer, which is impressions. People accept or decline, which is click through rate. Those who accepted either stay or leave, which is retention and satisfaction. What happened decides the size of the next offer.
Read in that order, a low impression count is almost never the disease. It is the symptom of the previous loop. The video that was offered 4,000 times and kept 42 percent of the people it got will be offered more next time. The video offered 4,000 times that kept 18 percent will be offered less, and no thumbnail change repairs that, because the thumbnail was never the part that failed.
This is also why chasing impressions directly is a dead end. There is no lever in Studio labelled show my video more. The only inputs you control are the offer's outcome: a cover and a title that earn the click, an opening that survives the first 30 seconds, and a video that pays what the title promised. If you want the five numbers that actually decide the next video, the analytics metrics that matter narrows the panel down to what changes a decision.
One warning about brand new uploads: the first hours of any video are noisy by construction, because the sample is tiny. A video with fewer than 100 views has a click through rate that swings wildly on almost no data, and reading a verdict into it produces panic edits that make the next video worse.
Where the impression came from changes the rate you should expect
YouTube publishes exactly one official benchmark for click through rate, and it is worth stating plainly: half of all channels and videos sit between 2 percent and 10 percent. Everything else you have read is market compilation, not policy.
The company also names the distortions in its own number. Impressions from the home page push the rate down, because the denominator explodes when your cover is shown to people who were not looking for you. Impressions from your channel page push it up, because those viewers already chose you. A channel doing 4 percent almost entirely from home is in a stronger position than a channel doing 6 percent almost entirely from its own channel page, and comparing the two as if they were the same metric leads people to fix what is not broken.
So compare like with like. Filter by traffic source, look at search against search and browse against browse over time, and only then decide whether the cover has a problem. The full set of bands, including watched percentage by video duration and what engagement should look like as a channel grows, is laid out in what counts as a good CTR and retention.
Watched percentage is the other side of the same coin, and it moves with duration rather than with quality. Market compilations put roughly 65 to 75 percent below 5 minutes, 50 to 60 percent from 5 to 10, 40 to 50 percent from 10 to 15, and 35 to 45 percent above 15. Those are market figures, not official ones, which is precisely why your own median over your last ten videos beats any external table.
The four real causes, and what each one looks like in Studio
Low impressions come from a small number of causes, and they leave different fingerprints. Reading the fingerprint first saves you from the usual mistake, which is redesigning a cover that was never the problem.
There is a fifth situation worth separating out: impressions that were high and then collapsed. That is a different investigation with different causes, and why your views dropped without you changing anything walks the cliff, the slope and the plateau one by one. This section is about the video that never got offered in the first place.
- Nobody to offer it to. A new channel has no history, so the first offer goes to the few surfaces that already know you. Fingerprint: total impressions in the low hundreds, most of them from the subscriptions feed, click through rate irrelevant because the sample is tiny.
- The offer was made and declined. Impressions are respectable, click through rate sits well under your own median for that traffic source. Fingerprint: healthy impressions, poor rate, and this is the one case where the cover and the title genuinely are the problem. What separates a 2 percent thumbnail from a 10 percent one covers the fix.
- The offer was accepted and the video lost the room. Rate is fine, retention collapses in the first 30 to 60 seconds, impressions shrink over the following days. The hook and the promise are misaligned, and the algorithm learned faster than you did.
- The topic has no demand. Search impressions near zero and browse impressions near zero at the same time is not a suppression signal, it is an absence of people asking. Confirm it against a channel in the same niche before you rewrite anything.
- The channel stopped publishing. Cadence is a signal in itself, and the surfaces that used to carry your videos gradually stop reserving space for a channel that went quiet.
The 20 minute diagnosis, in the order that saves time
Do it in this sequence, because each step tells you whether the next one matters. First, confirm the video is public, not scheduled, not limited, and has no strike or copyright claim blocking distribution. A surprising share of no impressions cases end here.
Second, open the traffic source breakdown and read where the impressions came from rather than how many there were. Third, compare the click through rate against your own median for that same source, never against a number from a blog. Fourth, look at the first 60 seconds of the retention graph, because a clean drop right after the hook is the algorithm's reason and not its punishment.
Fifth, check the cadence of the channel over the last 30 days. Sixth, and only if the first five came back clean, question the topic itself. Doing this in the reverse order is what makes people rebuild covers for a video whose problem was that it lost half the room at second 40.
The reason so few people run this every week is not ignorance, it is that it costs twenty minutes per video and nothing about it is enjoyable. Inside FalconVid the Senior AI Analyst does it for you: a real person with a name, a face and a voice assigned to your account, who reads your channels and your videos and writes every 2 days in your language, saying what went up, what went down, which video carried the month and what to do next inside the product. Plans from Pro upwards include that permanently, and Starter tests it free for 7 days from the panel. The full picture of how the analyst reads an account is on the AI YouTube analyst page.
The lever that actually compounds when impressions are low
When a channel is small, every honest answer converges on the same thing: more shots on goal, at a rhythm you can hold. Not because volume is magic, but because the loop needs data to run. Ten videos give the algorithm ten chances to find the audience that responds, and one video per month gives it almost nothing to learn from.
That is also the arithmetic behind the 2027 rule. New channels entering the Partner Program will need 8,000 qualified public watch hours in 365 days, and only public videos count towards it. At 1,000 views per 12 minute video with 40 percent watched, that is roughly 100 videos, which is why cadence stopped being a matter of style and became a matter of deadline.
By hand, 100 videos is 950 to 1,350 hours of work, which is the ceiling that ends most channels in month three. That ceiling belongs to the manual route. Produced through the pipeline, the same 100 videos cost 158,400 credits in economy mode, and they are built in parallel rather than one after another: from 2 simultaneous generations on Starter up to 50 on Scale, several channels at once, each with its own calendar, identity and language.
The shape of the work changes too. You approve a calendar once, the topics, the dates and the times, and the videos build themselves before their slot and publish on schedule to YouTube, Instagram, TikTok, Rumble and Facebook, in up to 63 languages, with a finished video in up to 30 minutes. Impressions still have to be earned. What changes is that you stop spending the week producing and start spending it reading what the offers came back with, which is the work that actually moves the number. Everything the platform does starts from the FalconVid home page.
What not to do while you wait
Do not delete and reupload a video that had a weak start. You throw away whatever watch hours it earned, the new upload starts from zero history, and nothing about the underlying loop changed. Reuploading is only defensible when the file itself is wrong.
Do not change the title and the cover at the same time. You lose the ability to tell which one moved the rate, and on a video with few impressions the change needs days of fresh offers before it means anything at all.
Do not buy views or traffic. Beyond the policy risk, it poisons the only feedback the loop uses: an audience that did not want the video watches badly, the satisfaction signal drops, and the next offer shrinks. You paid for the exact opposite of what you wanted.
And do not read a verdict into the first two hours. Give a video its window, keep publishing while it runs, and judge by the median of your last ten rather than by the one in front of you. Consistency is the only input the algorithm rewards that does not depend on luck.