
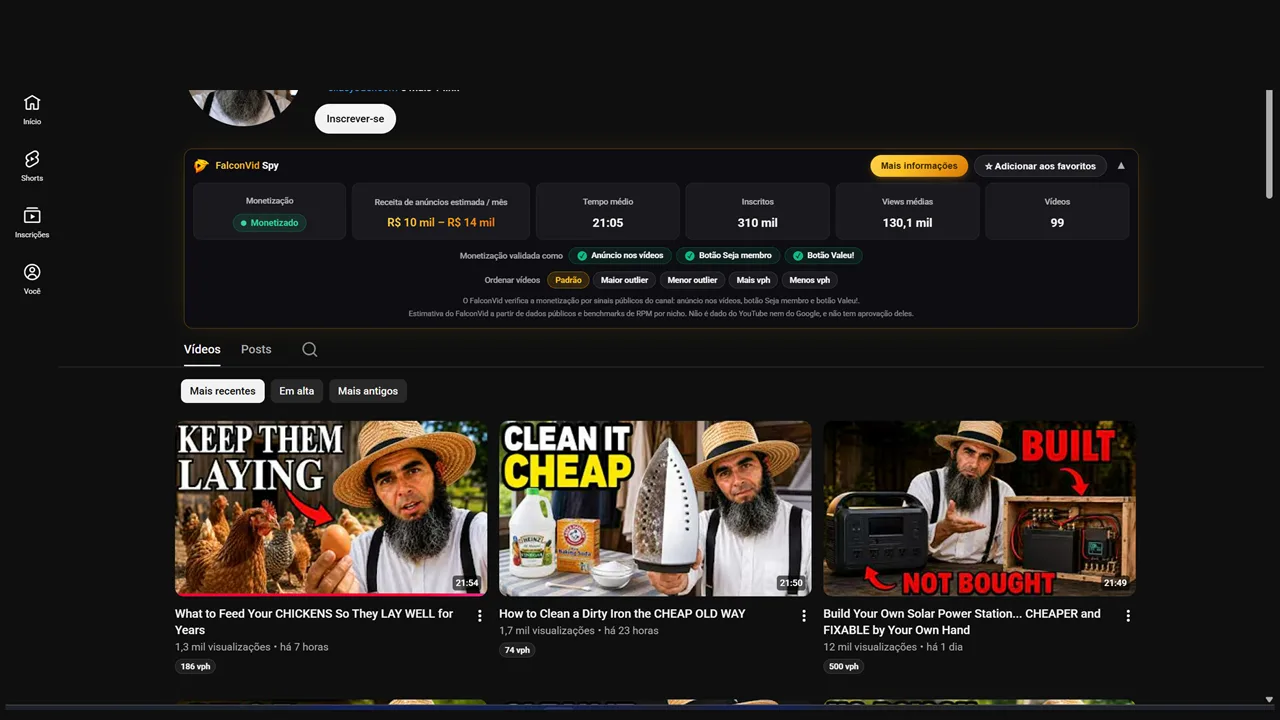
The problem: the channel page hides what matters
You open a channel on YouTube and see three things: subscribers, video count and thumbnails. None of them answers the questions that decide whether the channel is worth studying — does it make money? how much? is the pace sustainable? which video broke the pattern, and why?
Answering that by hand means five tabs, video by video, and you would still get the average wrong, because the old catalog distorts everything. The FalconVid extension runs that math while the page loads and puts the answer where you are already looking.
It does not replace FalconVid Spy. It is the first filter: three seconds to decide whether a channel deserves a full analysis.
- One click to install, then it works on its own on any channel you open
- Changes nothing in your YouTube account and never interferes with what you see
- Works in English, Portuguese and Spanish, following your FalconVid account language
Installing in under a minute
Installation is the same as any Chrome Web Store extension: click add, confirm in Chrome, done. No configuration, no key to paste, no hidden step.
On first open you get a screen explaining exactly what is sent to our servers — the public identifier of the channel you are viewing, and nothing else. You approve once and the extension never interrupts again.
If you do not have an account yet, the button itself leads to the free signup, no credit card.
- Click Add to Chrome and confirm
- Approve automatic analysis on the welcome screen
- Open any YouTube channel — the bar shows up by itself
Where the bar appears, and why there
The bar sits right below the channel header, above the Videos and Playlists tabs. That spot was not arbitrary: it is exactly where your eye already goes after reading the channel name and the subscriber count.
It follows YouTube's theme. On dark mode it is born dark; switch themes with the page open and it switches instantly.
If you want the space back, the button on the right collapses it, and it remembers your choice on the next channels.
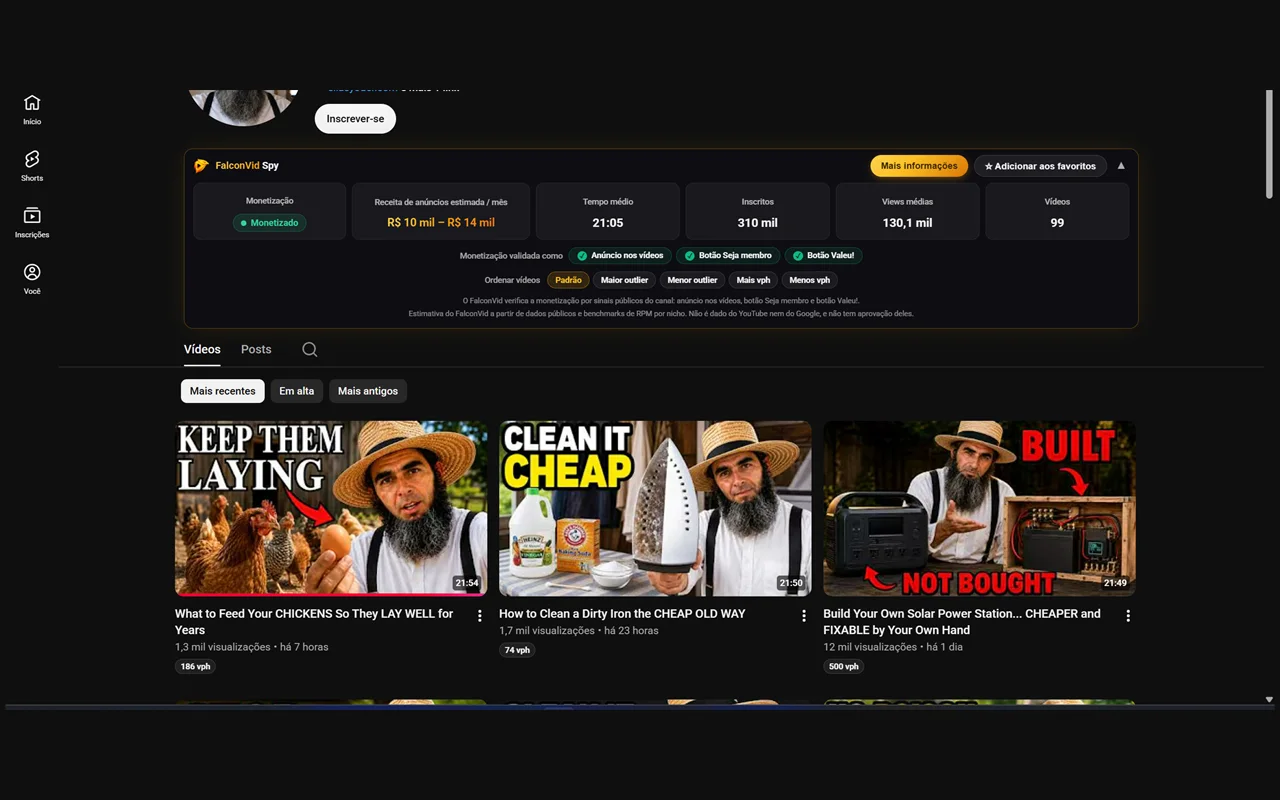
Every number on the bar, explained
Six cards, each answering a different question. Read together, they tell the channel's story in seconds.
- Monetization — whether the channel runs ads, and which public signals confirmed it
- Estimated monthly ad revenue — a range from views and the typical RPM of that niche
- Average length — the average video duration, which reveals the format before you open anything
- Subscribers — audience size
- Average views — how the typical video performs, which is the number that actually matters
- Uploads per week — publishing pace, measured over the last 90 days
Monetization: what the green badge really says
YouTube publishes nowhere whether a channel is monetized. Anyone claiming it is reading public signals, which is exactly what we do — except we show which signals were checked.
Below the badge you see the three signals: ads on videos, the Join button and the Super Thanks button. That is the evidence behind the claim, instead of an unexplained stamp.
Read it as high probability, not a bank statement. No tool has access to someone else's channel dashboard, and anyone suggesting otherwise is selling certainty that does not exist.
Estimated revenue: using it without fooling yourself
The revenue range is our estimate, from public data and the typical RPM of that niche. It says so on the bar itself, and we repeat it here: it is not YouTube or Google data.
The absolute figure matters less than the comparison. A channel your size earning three times more means its niche pays better — and that is the insight that changes your next decision.
Finance, software and insurance pay multiples of what entertainment and kids content pay for the same views. That is why two channels with identical audiences can have incomparable revenue.
- Compare channels against each other, not the isolated number
- Consider the whole range, not just the low or the high end
- Niche weighs more than size when it comes to revenue
Outlier and VPH: the two numbers on every video
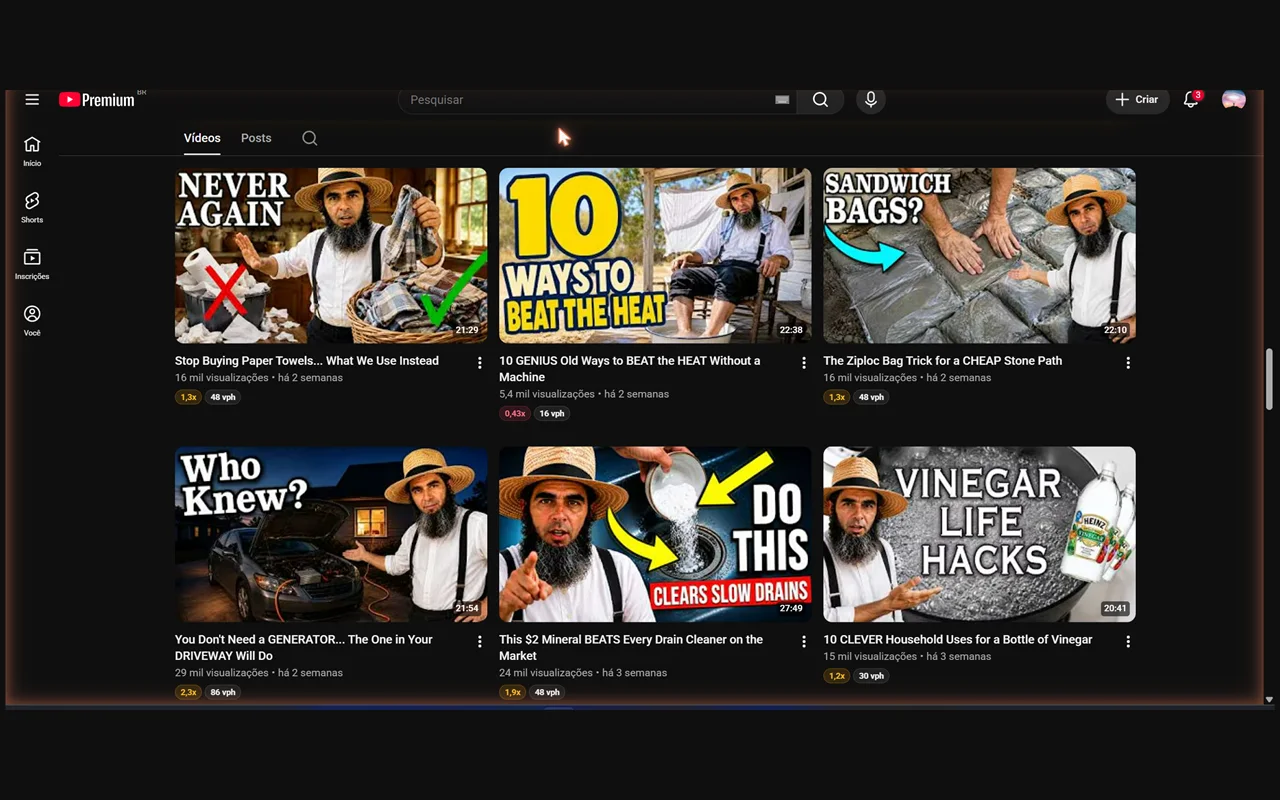
On the Videos tab, each thumbnail gets up to two tags. They answer different questions and should not be confused.
The outlier compares that video's views against the channel's recent typical performance. 1x is the median video. 3x means it did triple the usual — and that is where the information lives: something in that title, thumbnail or topic worked far better than the rest.
VPH is views per hour since publishing. It measures speed, not accumulation, which makes it the right metric for recent videos: yesterday's upload will never have high totals, but it may be climbing faster than anything else on the channel.
- Red — below normal for that channel
- Orange — around the average
- Green — clearly above average
- Blue — off the charts, the video that exploded
Why very new videos get no outlier
A video published hours ago has not had time to accumulate views. Comparing its total against the channel average would always land near zero, and every launch would show red, claiming failure when it was simply born.
So below three days we show only VPH. It is the honest metric for a new video — and in practice it is the one that predicts success: a launch with VPH far above the channel's normal usually becomes next week's outlier.
The same care applies to the baseline. We use the median of recent videos, not the average of the whole catalog, because a single old viral distorts the entire average and makes a channel look like it is collapsing when it is simply at its normal pace.
Sorting the grid: where research gets fast
The sort buttons reorder videos by outlier or VPH, highest to lowest or the reverse. It is the difference between scrolling a hundred videos and seeing the five that matter.
Highest outlier answers what worked best in the channel's recent history. Most VPH answers what is working right now. Lowest outlier has a less obvious and very valuable use: it shows what the audience rejected, and learning from someone else's failure is cheaper than learning from your own.
Sorting works on the videos already loaded on the page. Scroll a bit before sorting to bring more videos into the analysis.
I'm feeling lucky: discovery without a target
You do not always arrive with a channel in mind. The lucky button picks a random channel from the FalconVid Selection — our curated list of channels already analyzed — and opens it directly.
It is the tool for someone hunting a niche, not a channel. Every click is a random sample of what works on YouTube, with all the numbers already on screen.
Use it when you are out of ideas, or when you want out of the bubble the algorithm keeps showing you.
The recommended workflow: from six cards to a decision
After analyzing many channels, the routine that works is always the same. It takes under a minute per channel and avoids the most common mistake, which is falling in love with the first big channel you see.
- Check monetization and estimated revenue first — if the channel makes no money, the rest is curiosity
- Compare average views against subscribers: high views with low subscribers means the algorithm is pushing the content, the easiest scenario to replicate
- Look at uploads per week — a pace you cannot sustain is not a model for you
- Sort by highest outlier and open the first three videos
- Find the pattern between them: format, title style, thumbnail promise
- Favorite the channel and open More info for the full history in Spy
How to actually find good channels
A good channel to study is not the biggest one. It is the one whose success you can explain and repeat.
The most valuable profile is a small channel with high average views: it means the content, not the subscriber base, is driving the result. A ten thousand subscriber channel with a hundred thousand views per video teaches far more than a two million subscriber channel with fifty thousand.
Avoid channels carried by celebrity or brand. What works there will not work for you, because the asset is the name, not the format.
- Average views far above the subscriber count
- Several outliers, not one isolated viral
- Steady publishing pace, a sign of process rather than luck
- A replicable format that does not depend on one specific person's face
Analyzing a direct competitor
When the channel is in your niche, the reading changes. You are not looking for what to copy, but for where they are strong and where they left room.
Sort by highest outlier and note the topics. Then sort by lowest outlier and note those too — what they tried and failed saves you weeks.
Compare their average length against yours. A large duration gap in the same niche almost always means a different format, and format is the easiest variable to test.
Advanced tips and shortcuts
A few habits separate people who use the extension from people who actually extract value from it.
- Favorite before analyzing: it takes a second and the channel is saved in Spy so history accumulates
- Compare outlier and VPH on the same video — high outlier with low VPH is an old success, not a current trend
- On recent videos, VPH predicts next week's outlier
- Open competitors in background tabs: the bar analyzes each one before you even get there
- Sort by lowest outlier once in a while — what failed is the information nobody publishes
Common mistakes that ruin the reading
Almost every misreading comes from comparing things that are not comparable.
- Treating estimated revenue as an exact figure — it is a range, meant for comparison
- Judging a launch by its outlier: new videos are read by VPH
- Comparing channels across niches by revenue, ignoring that RPM changes everything
- Sorting without scrolling first, then concluding from a handful of videos
- Looking only at the top video: one isolated viral is usually luck, several outliers are method